
Notice
Recent Posts
Recent Comments
Link
| 일 | 월 | 화 | 수 | 목 | 금 | 토 |
|---|---|---|---|---|---|---|
| 1 | 2 | 3 | 4 | |||
| 5 | 6 | 7 | 8 | 9 | 10 | 11 |
| 12 | 13 | 14 | 15 | 16 | 17 | 18 |
| 19 | 20 | 21 | 22 | 23 | 24 | 25 |
| 26 | 27 | 28 | 29 | 30 | 31 |
Tags
- mariaDB
- git
- 자바
- Deep
- Linux
- centos
- SSH
- interface
- mysql
- db
- learning
- Github
- Spring
- Numpy
- framework
- Python
- ai
- 인공지능
- DeepLearning
- Pattern
- data
- LIST
- Web
- java
- Security
- Analysis
- error
- javascript
- Server
- 함수
Archives
- Today
- Total
목록bigdata (1)
PostIT
 [Python/Data Analysis] Numpy 및 Matplotlib 사용하기 - Day 5
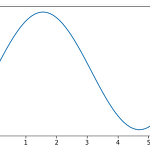
# [Python/Data Analysis] Numpy 및 Matplotlib 사용하기 - Day 5 import numpy as np import matplotlib.pyplot as plt # 1 - Pyplot example x = np.arange(0,6,0.1) y = np.sin(x) plt.plot(x,y) plt.show() # 2 - Pyplot example a = np.arange(0, 6, 0.1) b1 = np.sin(a) b2 = np.cos(a) plt.plot(a, b1, label="sin") plt.plot(a, b2, linestyle="--", label="cos") # a axis name plt.xlabel("a") plt.ylabel("b") plt.title("..
Python/Data Analysis
2017. 5. 24. 09:41